Datamations: Animated Explanations of Data Analysis Pipelines
Abstract
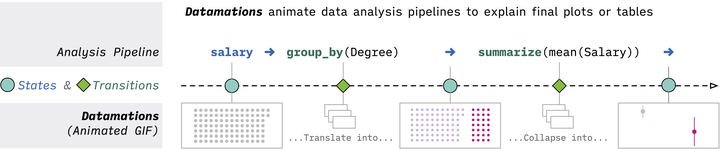
Plots and tables are commonplace in today’s data-driven world, and much research has been done on how to make these figures easy to read and understand. Often times, however, the information they contain conveys only the end result of a complex and subtle data analysis pipeline. This can leave the reader struggling to understand what steps were taken to arrive at a figure, and what implications this has for the underlying results. In this paper we introduce datamations, which are animations designed to explain the steps that led to a given plot or table. We present the motivation and concept behind datamations, discuss how to programmatically generate them, and provide the results of two large-scale randomized experiments investigating how datamations affect people’s abilities to understand potentially puzzling results over seeing only final plots and tables containing those results.